
A CGM, or Continuous Glucose Monitor, is a wearable device that tracks your glucose (sugar) levels 24/7. Think of it as the difference between a still photo and a movie: while a traditional finger-prick test gives you a single snapshot in time, a CGM provides a constant stream of data so you can see exactly how your levels rise and fall in response to food, exercise, and sleep.
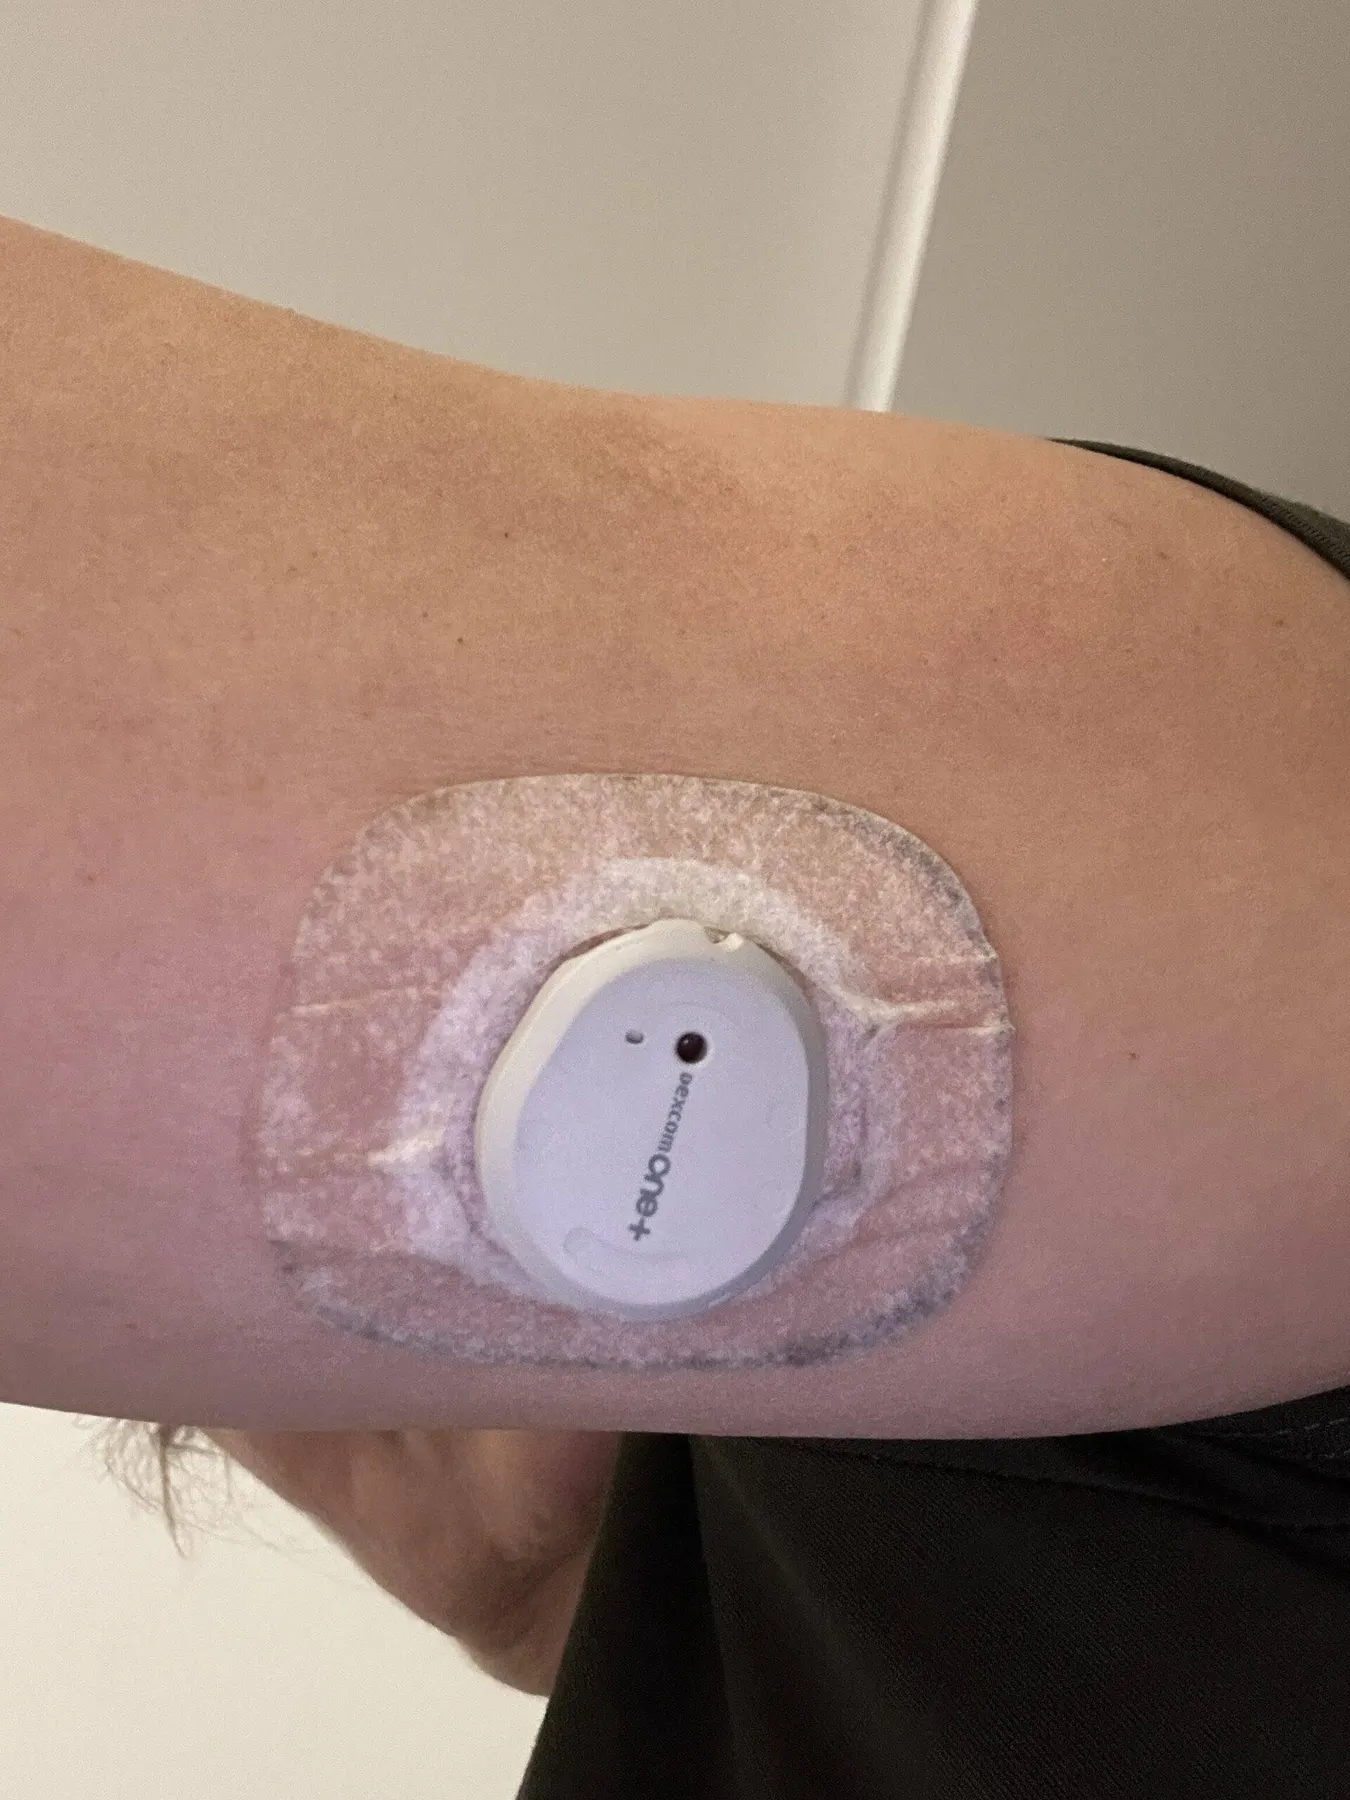
What led me to this experiment was a module in the course I began in 2025 with Dr. Vanessa Kimbell: Bake as a Lifestyle Medicine (BALM) Protocol.
The BALM Protocol is much more than a baking class; it is a comprehensive system of baking, eating, and sharing bread as preventative healthcare. It positions the act of baking as the central pillar for meaningful lifestyle changes.
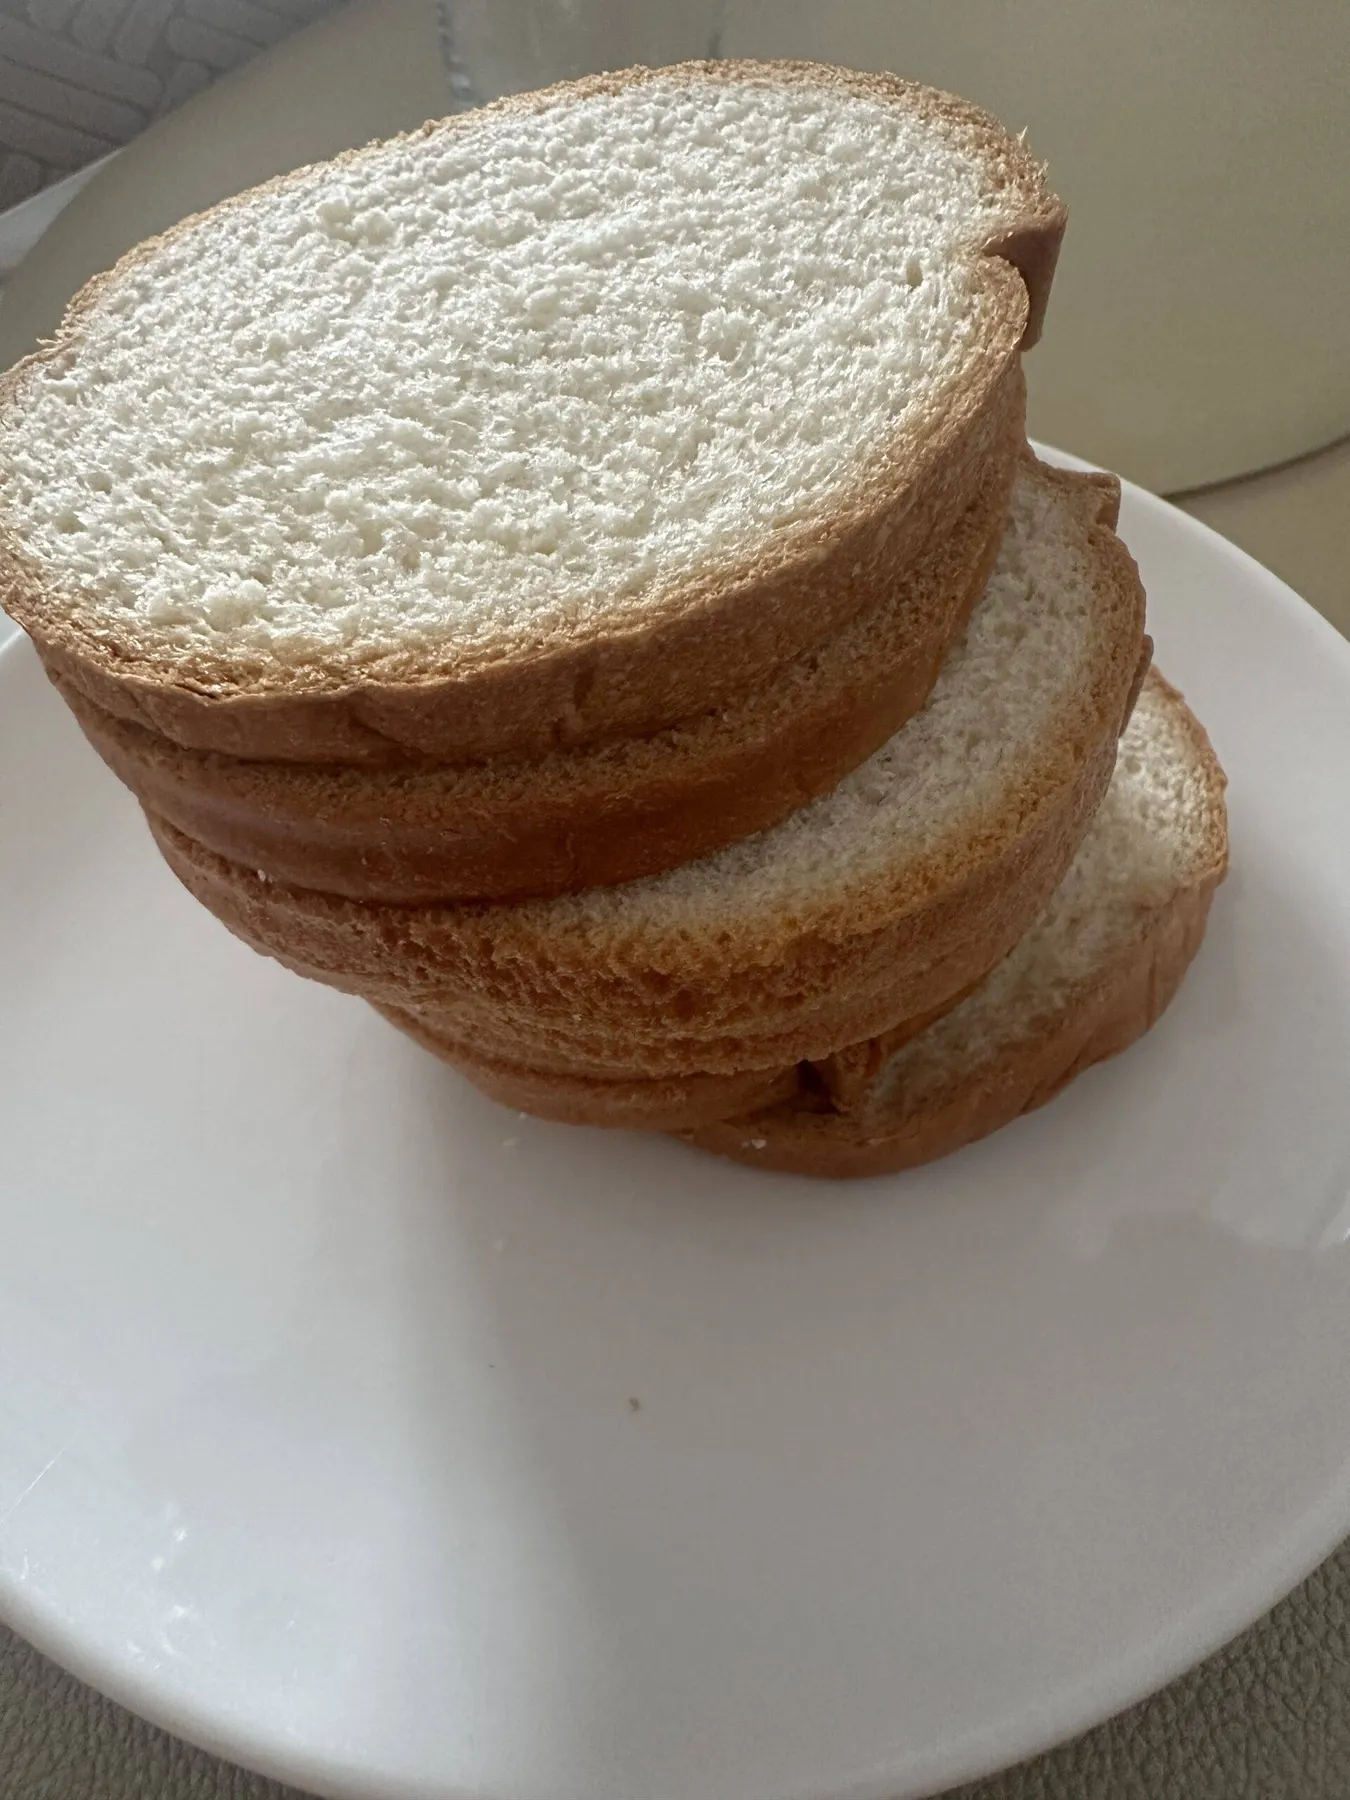
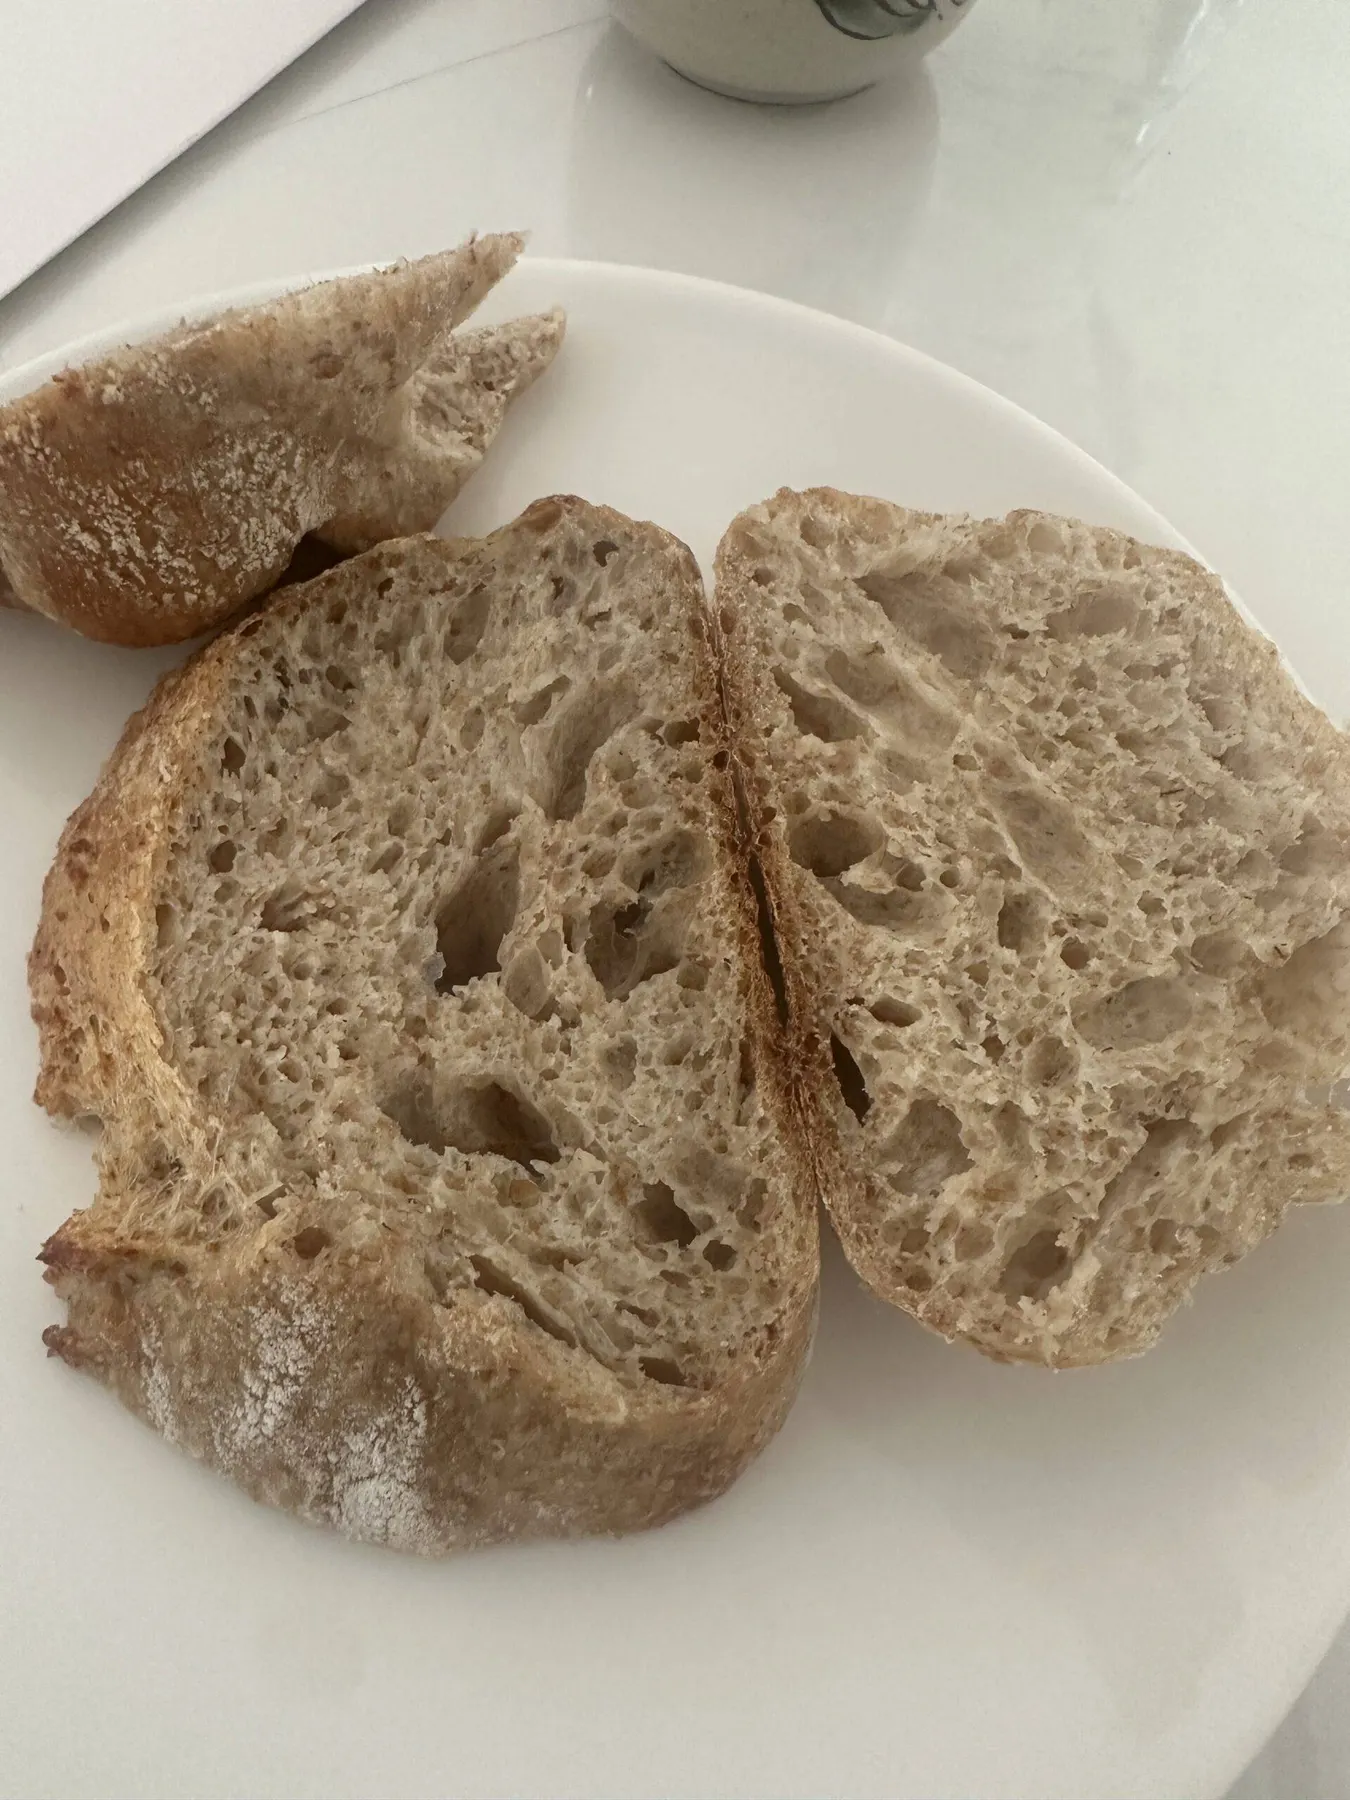
The task was Test 1: to eat around 100g of bread on its own (naked), nothing before and nothing with it, just the bread and monitor the baseline blood glucose before eating, and the peak reading. Test 2: start with a sequencing eating (eat before the bread like olives, raw vegetables, fermented vegetable) then eat the 100mg bread paired with protein and fat and monitor the baseline blood glucose before eating, and the peak reading. Test 1 and 2 with different kinds of bread ( white shop-bought bread, 20% homemade wholegrain sourdough, 50% homemade wholegrain sourdough, 100% homemade wholegrain sourdough.
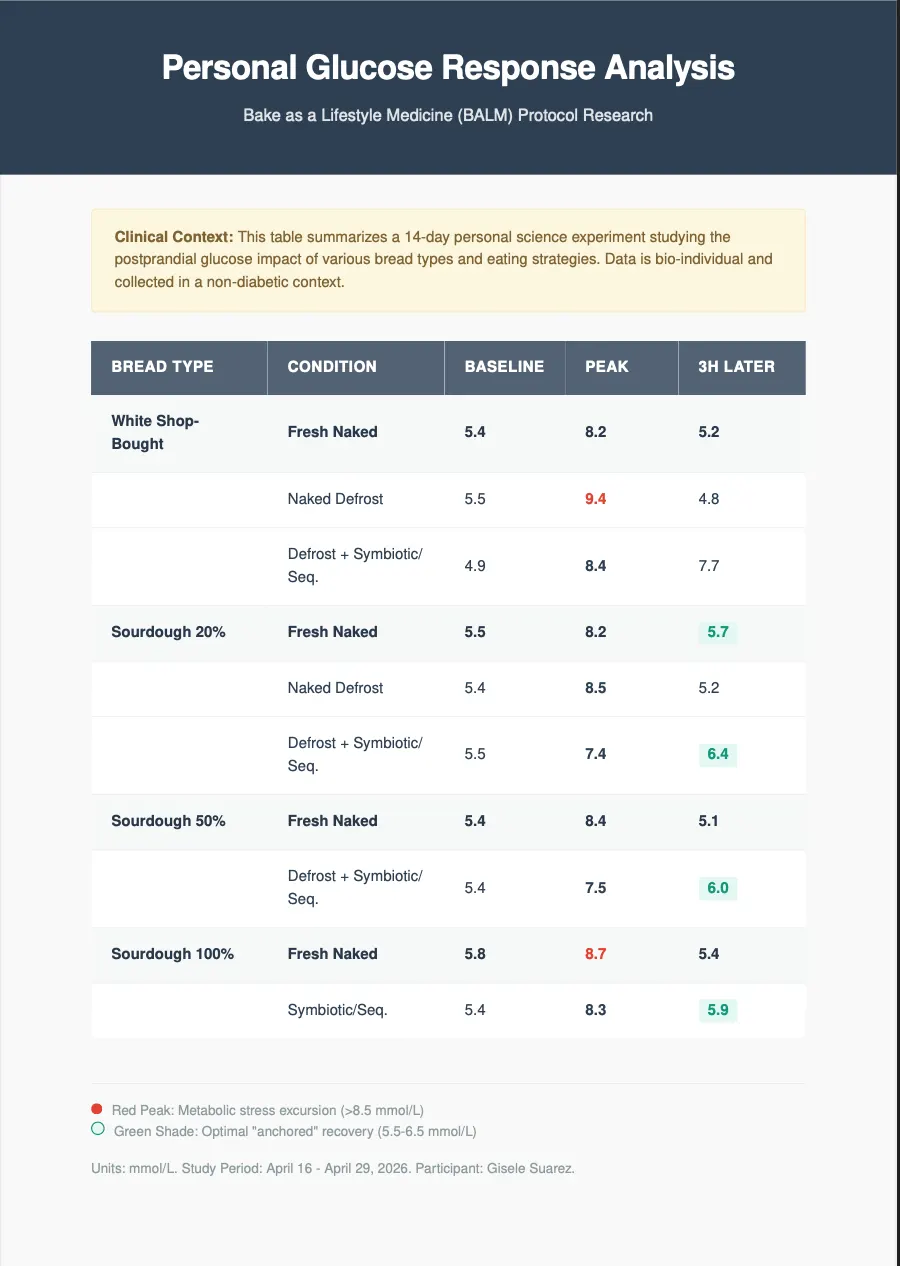
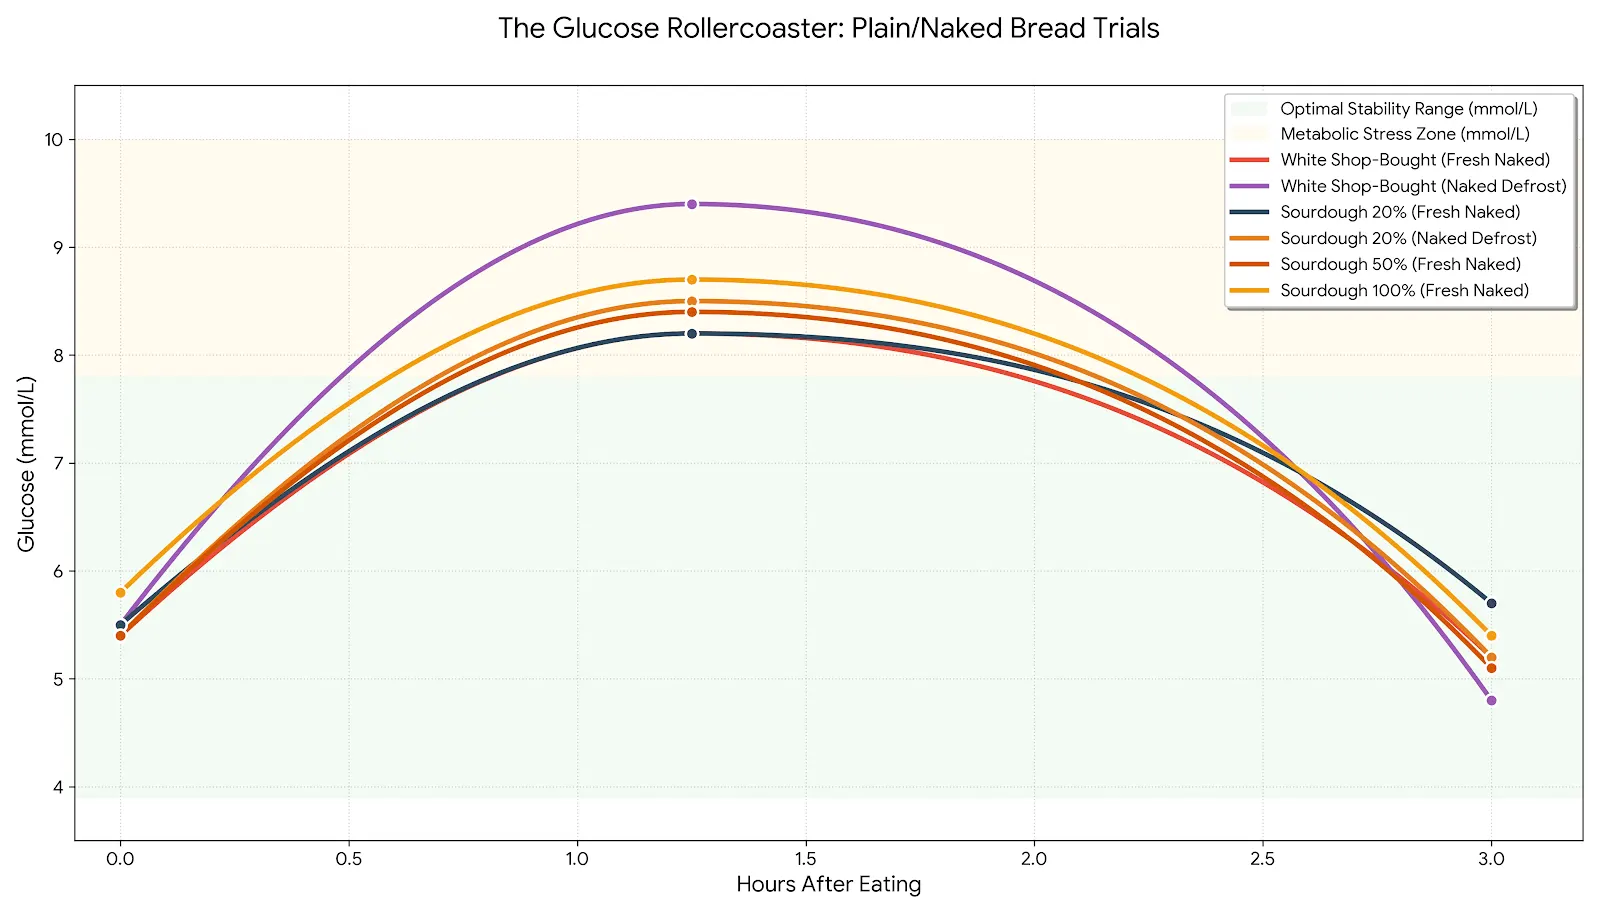
Glucose Rise & Fall: Plain/Naked Breads
This graphic shows the metabolic response when bread is eaten without the symbiotic buffer (naked).
Volatile Spikes: Notice how most curves reach high into the “Metabolic Stress Zone.” The shop-bought white bread (Naked Defrost) shows the highest peak at 9.4 mmol/L.
The Crash: You can clearly see the “rollercoaster” effect where glucose levels often drop sharply, sometimes falling below my starting baseline 3 hours later (e.g., falling to 4.8 mmol/L).
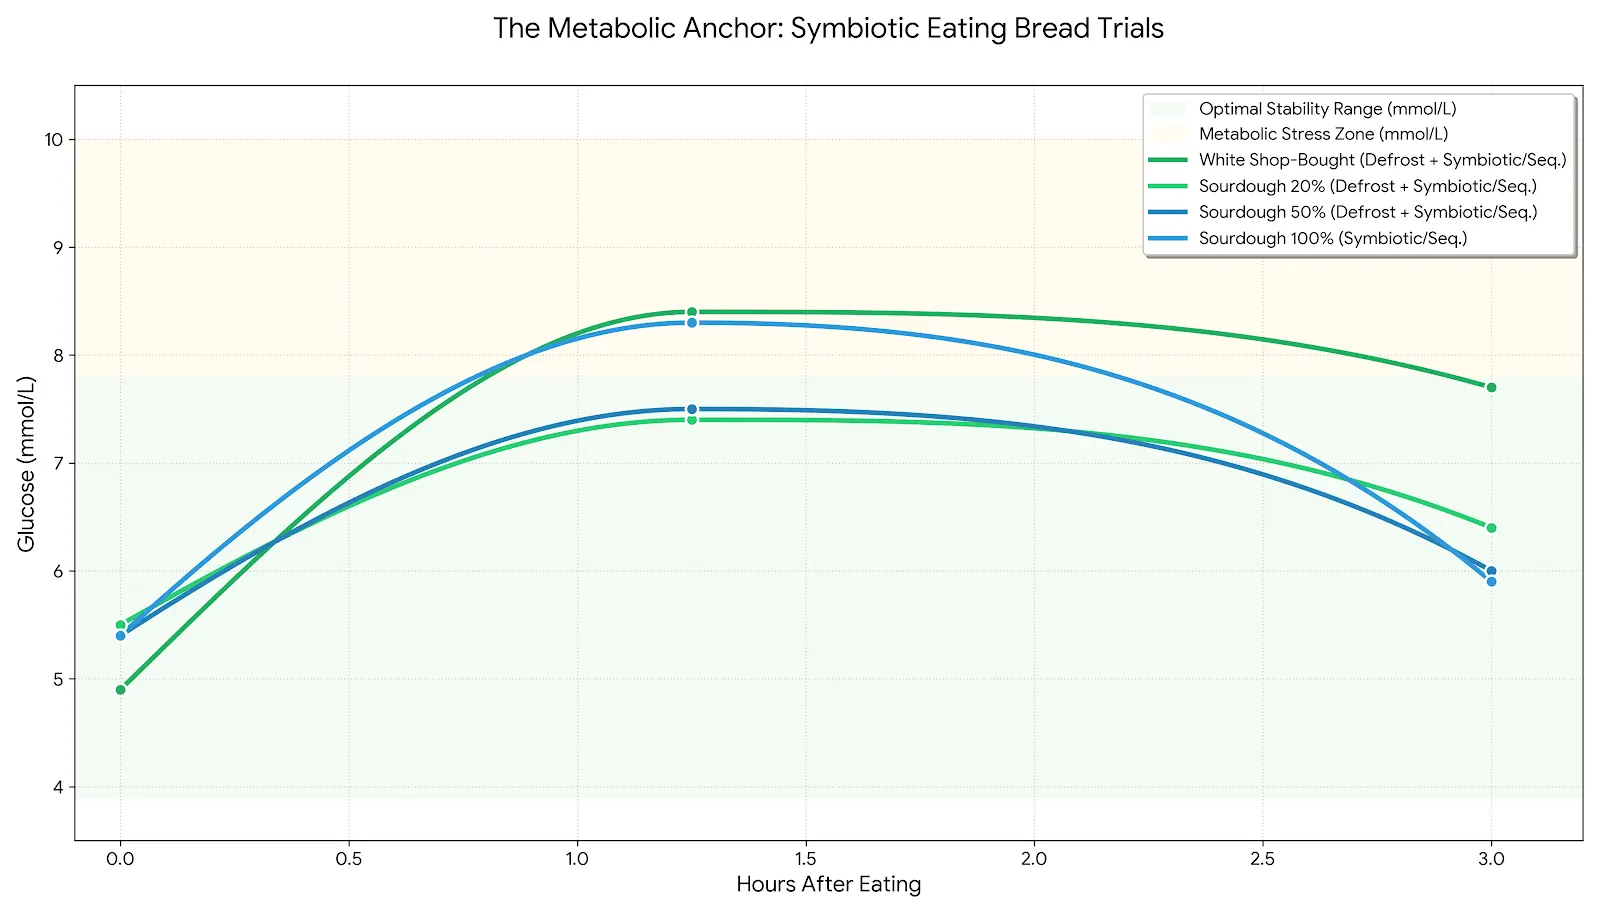
Glucose Rise & Fall: Symbiotic Eating Breads
This graphic demonstrates the stabilizing power of the Symbiotic Buffer and proper Food Sequencing.
Flatter Hills: Instead of aggressive spikes, the curves are much more gradual. The highest peak here is significantly lower than the naked trials.
Metabolic Anchoring: Notice how the levels 3 hours later land much more stably. Instead of crashing, my body maintains a steady energy supply, often landing between 5.9 and 7.7 mmol/L, which prevents the “sluggishness” associated with glucose dips.
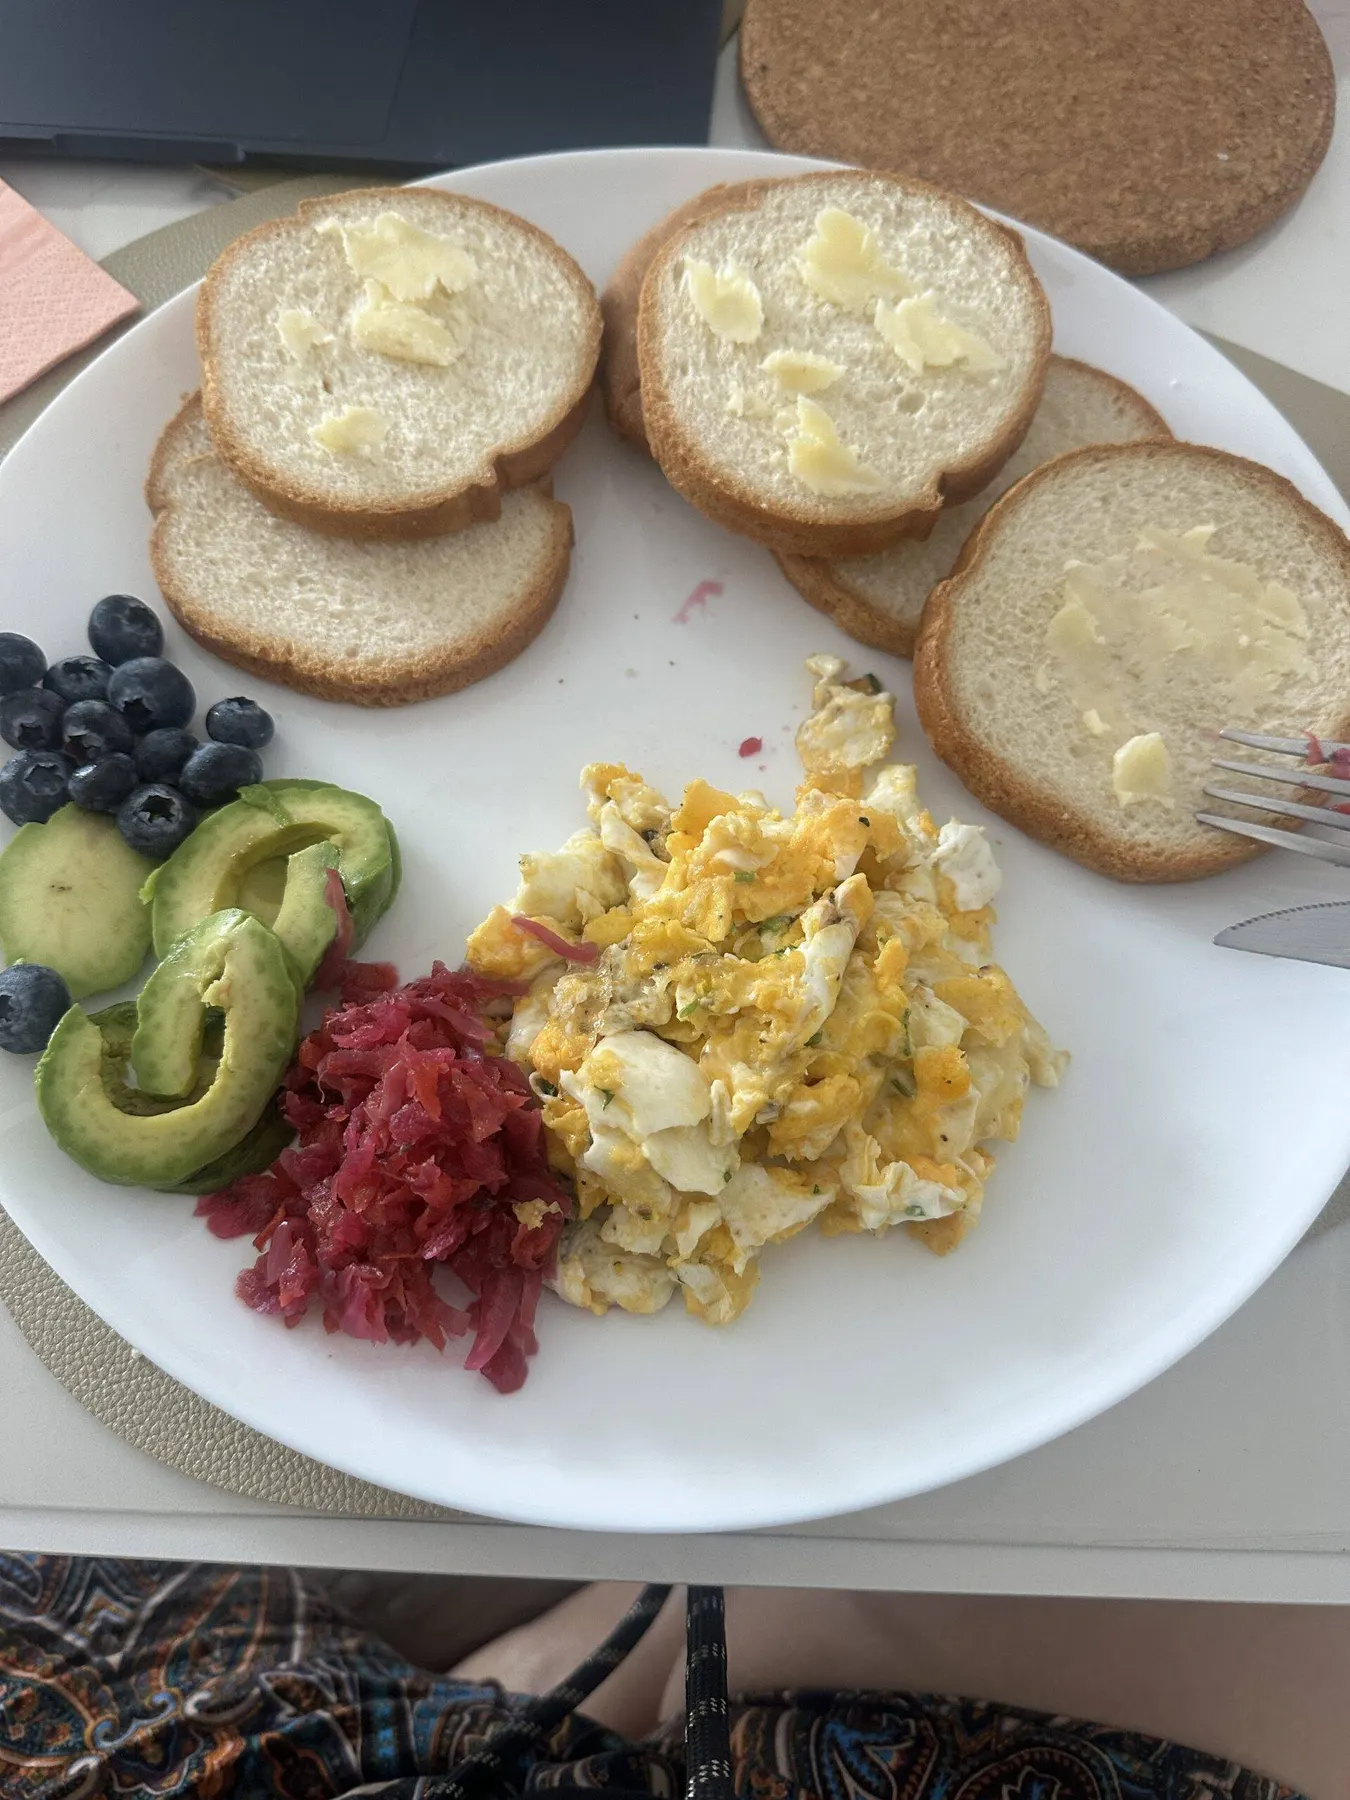
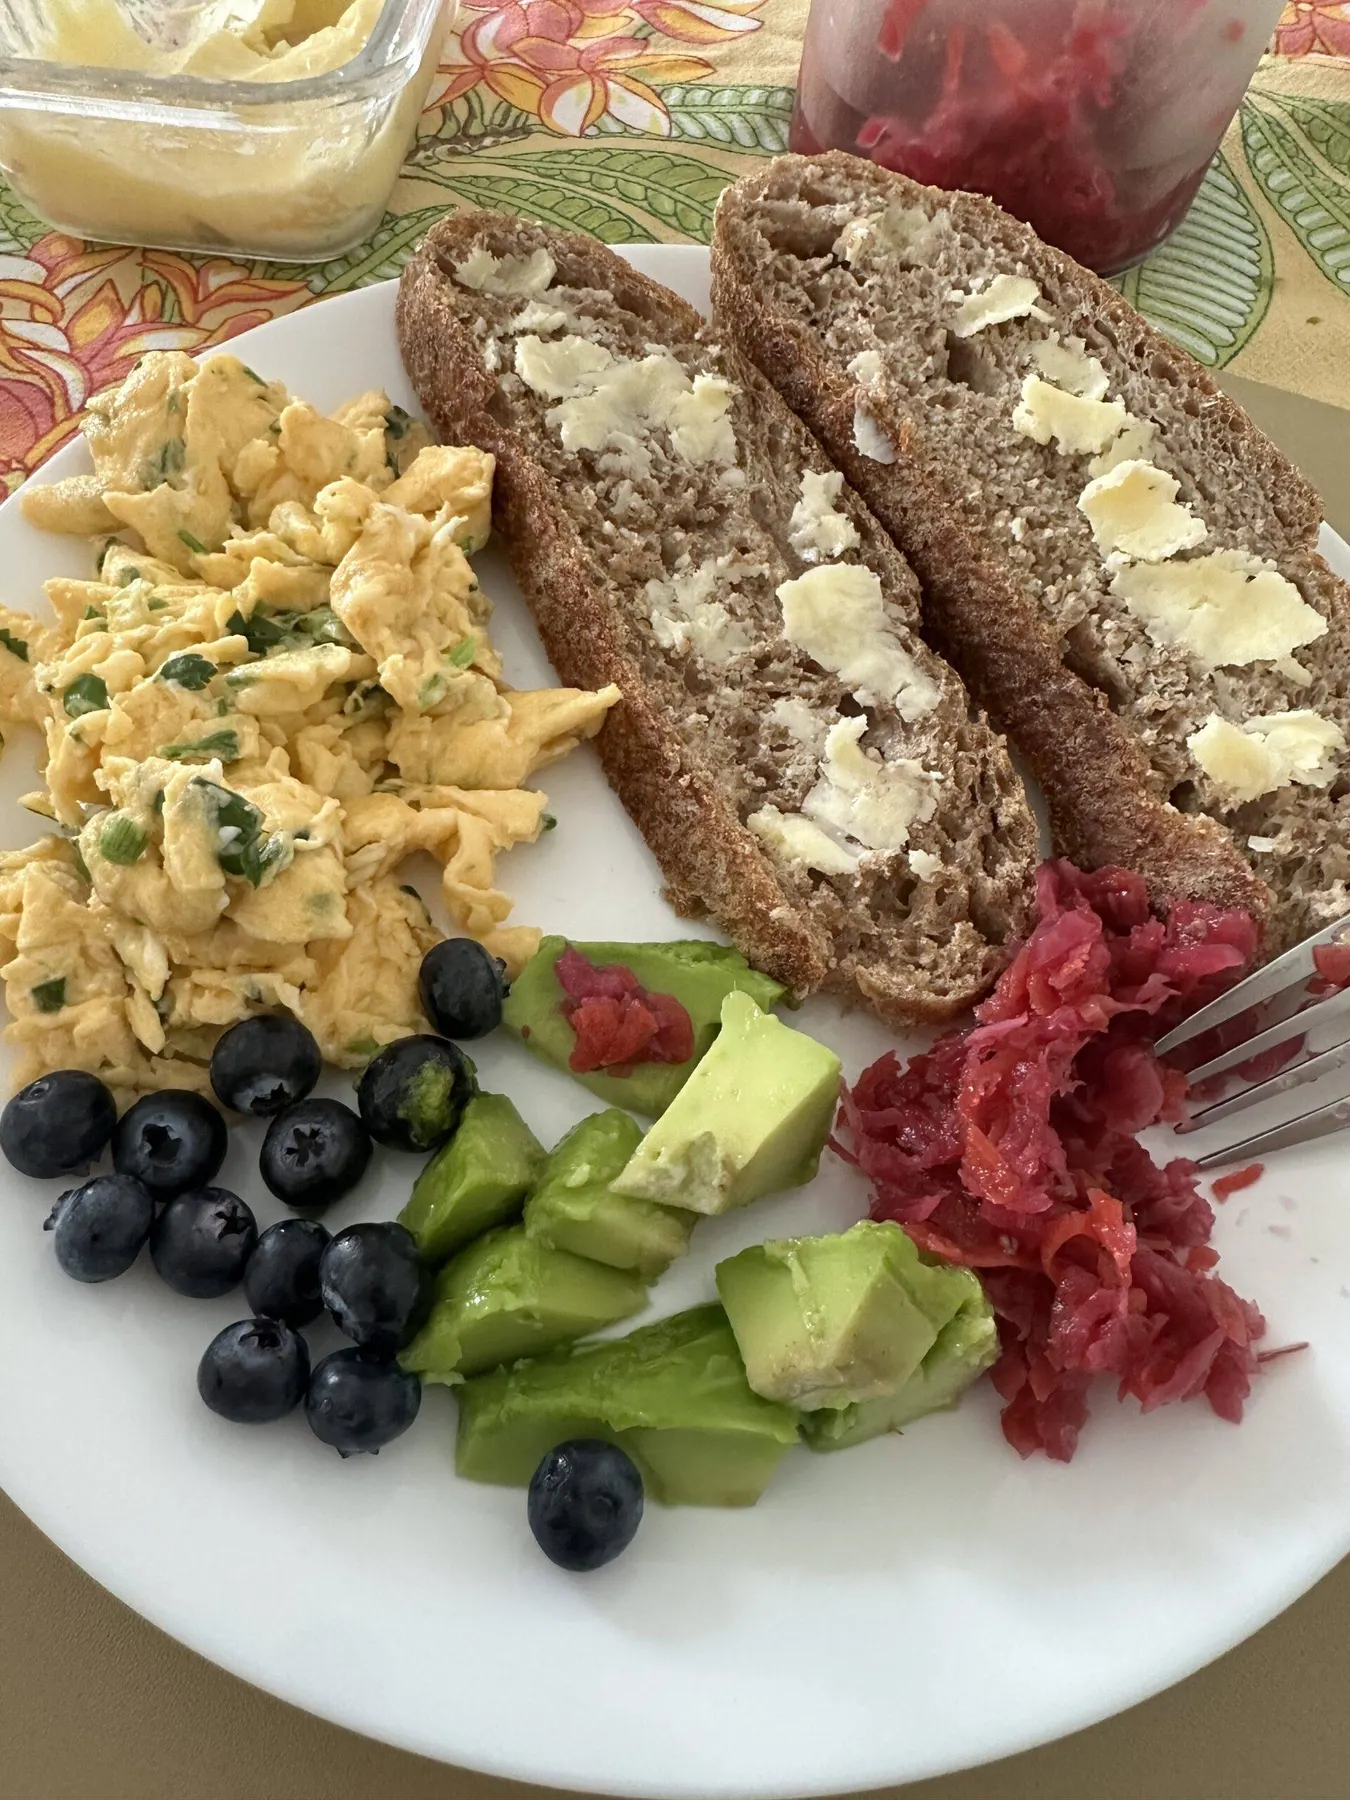
This whole experience has been about fine-tuning my craft and learning how to tailor bread to my own body. It wasn’t about realizing I was doing something “bad” before; it was about taking what I’ve been studying in the BALM protocol and seeing exactly how it works for me. For me, the goal has shifted from just trying to bake a “perfect” Instagram loaf to focusing on how bread can actually function as preventative healthcare.
The data from these 10 days really just reaffirmed what I’ve been learning. It showed me that things like food sequencing—starting with fiber and protein actually matter way more for my energy levels than just looking at a calorie count. It’s about the whole ecology of the meal. By using long fermentation and adding in a massive diversity of ingredients like different fibers and antioxidants, I’m making the bread work for me, not against me.
Integrating live bacteria through things like kefir or sauerkraut was a huge part of the puzzle. It’s about making the meal symbiotic so my gut and my blood sugar stay stable. Seeing my average glucose land at 6.1 and staying in range 99% of the time was great, but the real win is knowing I can now personalize my baking to be as functional as it is delicious. I’m moving away from just following a recipe and moving toward baking for health. This study was just the confirmation I needed that focusing on the science the fermentation, the diversity, and the way I pair my food is what really makes the difference for my long term well being. The beautiful crust is just a bonus now.